

1. Why This Sensor & Introduction
1.1 Why the HC-SR04 is worth your time
The HC-SR04 is the sensor most people meet first when they want a microcontroller to “see” distance, and there is a good reason for that. A parking assistant that beeps faster as your bumper nears the wall, a robot that stops before it drives into a table leg, a contactless tank gauge that reads how full a water barrel is without ever touching the liquid: all three can be built with this one small board. In this project you wire it to an ESP32, read distance in centimeters, and then watch the numbers move in real time on a web dashboard your phone opens over WiFi. Distance sensing sits underneath a lot of robotics, so it pays to understand not just the wiring but why the reading is what it is, where it drifts, and when it quietly lies to you. Get that right here and every later sensor in the series becomes easier to reason about.
1.2 What the HC-SR04 actually is
The HC-SR04 is an ultrasonic distance module: two metal cylinders on a small blue board, one that sends a burst of sound too high for you to hear and one that listens for the echo. It measures from about 2 cm out to 400 cm, runs on 5 volts, and reports distance by the width of a single pulse. It costs about a euro, which is why it shows up in almost every starter kit. If you would rather drive it from an Arduino Uno, I covered that build separately in the برنامج تعليمي لمستشعر المسافة بالموجات فوق الصوتية Arduino — the wiring is simpler there, because a 5 volt board needs no divider on the Echo line.
2. How It Works
2.1 The sensing principle
Think about shouting across a canyon and counting the seconds until your voice comes back. Sound travels at a fixed speed, so the delay tells you how far away the far wall is. The HC-SR04 does exactly that, just faster and quieter. When you give it a short go signal, it chirps eight cycles of 40 kHz sound out of its transmitter, a pitch far above what human ears can pick up. That chirp travels through the air, hits whatever is in front of the sensor, and bounces back to the receiver. The sensor measures how long the round trip took.
The one detail people forget is the word “round”. The sound has to fly to the object and all the way back, so the measured time covers twice the distance you care about. That is why the formula divides by two later. The sensor itself does not know the distance in centimeters; it only knows a duration. It hands you that duration as an electrical pulse and leaves the arithmetic to your ESP32. A 40 kHz burst was chosen because it carries well through air over these short ranges and because cheap piezo transducers resonate happily at that frequency.
2.2 The key equation
The sensor gives you the echo time in microseconds. Speed of sound in dry air at 20 degrees Celsius is about 343 meters per second, which is easier to use as 0.0343 centimeters per microsecond. So:
distance (cm) = (echo_time_us * 0.0343) / 2
Every term earns its place. echo_time_us is how long the Echo pin stayed high, in microseconds, straight off the ESP32. 0.0343 converts microseconds of flight into centimeters of travel. The / 2 removes the return leg, because the pulse timed the trip out and back. The datasheet folds all of that into a shortcut, distance_cm = echo_time_us / 58, and the two agree: 1 divided by (0.0343 divided by 2) is 58.3.
A worked example makes it concrete. Say the Echo pin stays high for 1160 microseconds. Multiply by 0.0343 to get 39.79 centimeters of total sound travel, then divide by 2, and you land on 19.9 cm. The shortcut gives 1160 / 58 = 20.0 cm, the same answer within rounding. So an object about 20 centimeters away produces roughly an 1160 microsecond echo pulse.
One honest caveat lives inside that 0.0343. The speed of sound rises with temperature, roughly 0.6 meters per second for every degree Celsius. On a warm day the true distance is a fraction of a percent shorter than the formula claims. For most hobby work that error is smaller than the sensor’s own noise, but it is the reason precision setups add a temperature reading.
2.3 Inside the module, step by step
Here is the full chain from your command to a number on screen:
- Trigger: your ESP32 holds the Trig pin high for 10 microseconds, the “start measuring” signal.
- Emit: the module fires eight cycles of 40 kHz ultrasound from the transmitter can.
- Travel out: the sound crosses the gap to the object.
- Reflect: the object bounces part of the sound back toward the sensor.
- Receive: the receiver can detects the returning echo.
- Echo pulse: the module raises the Echo pin and holds it high for exactly as long as the round trip took.
- Measure: your ESP32 times that high pulse in microseconds.
- Calculate: you apply the formula above and get distance in centimeters.
3. Interactive Animation
The animation below sends a burst, shows it travel to the object and echo back, and updates the distance, the echo time, and the equation live as you drag the slider. Set the object to 20 cm and you get the 1160 microsecond echo from the worked example; slide it out toward 400 cm and watch the echo time stretch. Try it yourself: drag the range slider or press Ping, then hit Auto sweep to see the reading move on its own.
If the animation does not load, open it in a new tab.
4. Wiring, Components & OmBlock
4.1 Bill of materials
You need very little for this build: an ESP32, the HC-SR04 itself, two resistors for a voltage divider, a breadboard, and a handful of jumper wires. The whole set runs about six to nine euros, most of which is the ESP32.
The two resistors matter more than their price suggests. They protect the ESP32 from the sensor’s 5 volt output, and section 4.2 explains why.
4.2 Wiring it up
The HC-SR04 has four pins: VCC, Trig, Echo, and GND. Three of them are simple. VCC goes to the ESP32 5V pin, GND goes to ESP32 GND, and Trig goes to GPIO 5. The fourth pin, Echo, is the one that catches people out.
Echo idles low and then pulses up to 5 volts to report the distance. ESP32 inputs are 3.3 volt pins, so putting a raw 5 volt signal on GPIO 18 stresses it and can kill the pin over time. The fix is a voltage divider, two resistors in series that split the 5 volts down to a safe level. R1 (1 kOhm) sits between Echo and a middle node; R2 (2.2 kOhm) sits between that node and ground. The ESP32 reads the node, where the voltage is 5 x 2.2 / (1 + 2.2) = 3.44 volts.
A word on that second value, because I picked it by accident and then kept it. Most tutorials say 1k and 2k, which lands neatly on 3.33 volts. I went to my resistor kit and there was no 2 kOhm in it, because 2 kOhm is not an E12 standard value and kits are built from the E12 series. 2.2 kOhm was right there, so 2.2 kOhm it was. The node sits at 3.44 volts, a hair above the 3.3 volt rail but well under the ESP32’s 3.6 volt absolute maximum, and the board has been reading happily for hours. If it bothers you, 2.2k for R1 and 3.3k for R2 gives you 3.0 volts using two values that are actually in your kit. Trig does not need this treatment because the sensor is happy to be triggered by the ESP32’s 3.3 volt output.
Here is the full mapping:
| HC-SR04 pin | ESP32 pin | Wire color | Note |
|---|---|---|---|
| VCC | 5V / VIN | red | full 5 V, not 3.3 V |
| المثلثات | GPIO 5 | blue | 3.3 V drive is enough |
| الصدى | node -> GPIO 18 | yellow | through the R1/R2 divider |
| GND | GND | black | connect this first |
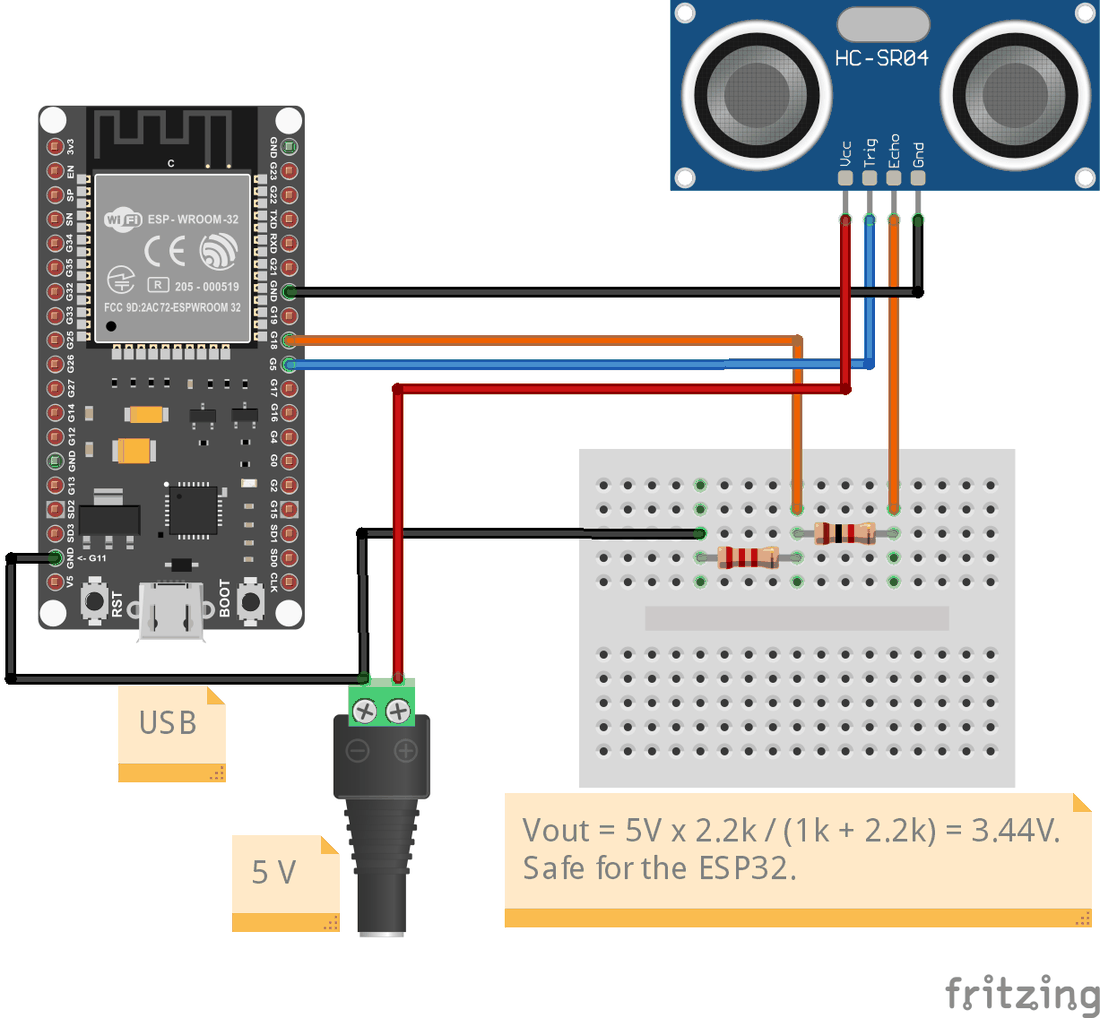
Orange is Echo, blue is Trig, red is 5 V, black is ground. The two resistors sit in one column on the small breadboard: 1k from Echo down to the middle row, 2.2k from that row to ground, and the wire to GPIO 18 taps the row between them.
Wire it in this order: ground first, then VCC, then Trig, then build the divider and run the node to GPIO 18. Avoid GPIO 6 through 11, which the ESP32 uses for its flash chip. GPIO 5 and 18 are safe.
4.3 The OmBlock enclosure
Every sensor in this series gets an OmBlock, a small 3D-printed holder that snaps into the OmBase grid so you can build a tidy bench setup instead of a loose breadboard. The same grid carries the OmArm Zero robot arm, which is where the system started. OmBlock-HC-SR04 has two 16 mm openings for the transducer cans and a rear channel for the four wires, and it sits next to OmBlock-ESP32 and OmBlock-Power. Print it in PLA at 0.2 mm with no supports. The STL download link is in section 9.
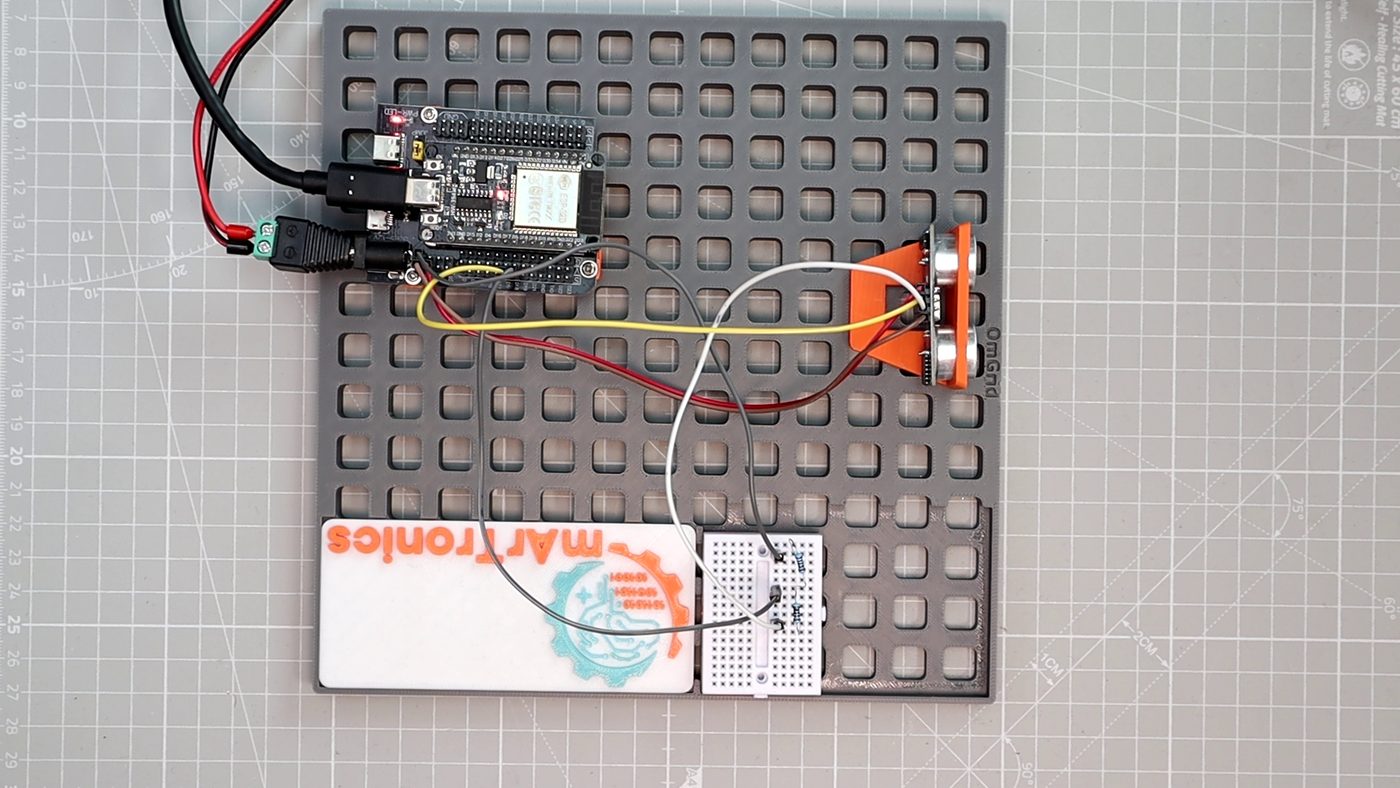
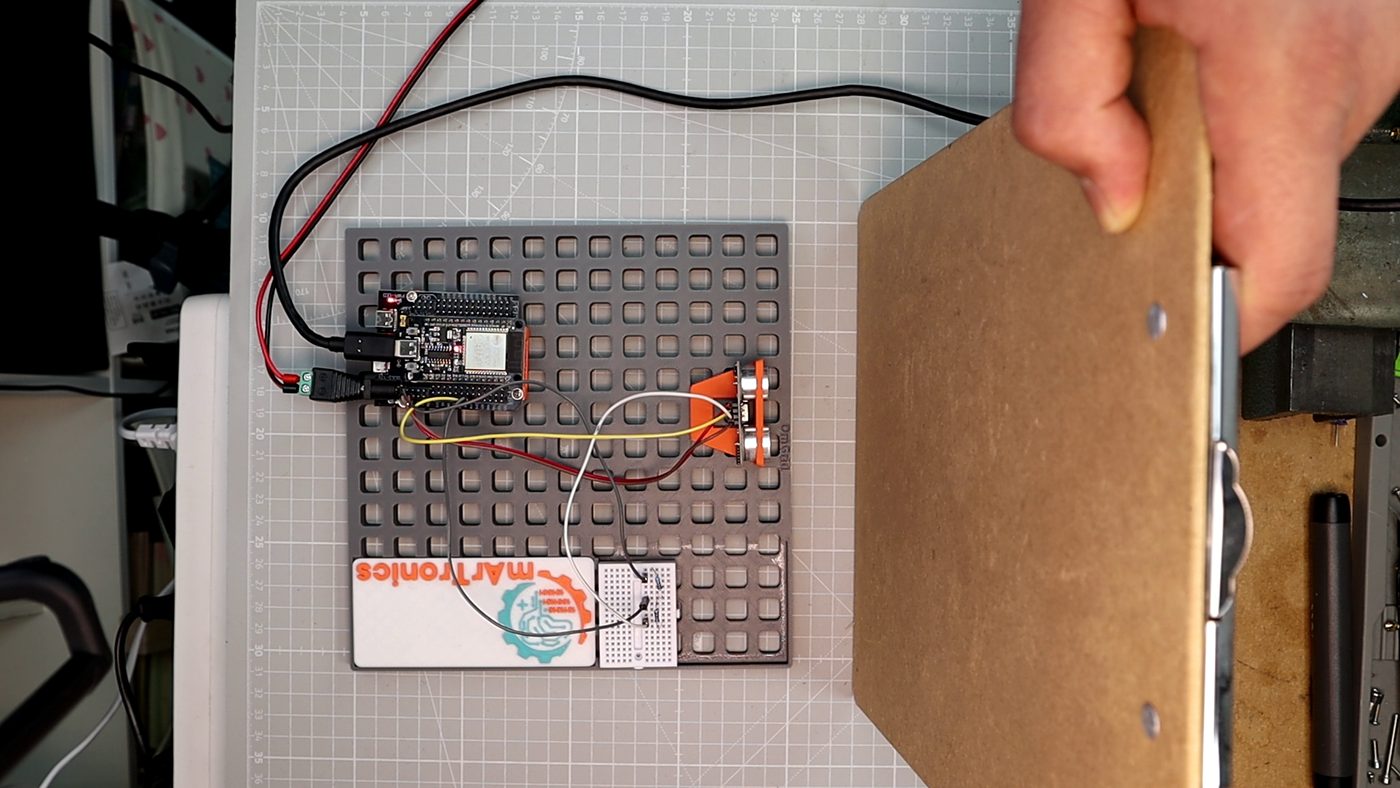
Printed in orange PLA, it holds the two transducer cans square to the target, which matters more than it sounds: an ultrasonic sensor tilted a few degrees off the surface it is measuring loses the echo entirely. Before the OmBlock I was propping the module against a battery pack and wondering why readings dropped out.
4.4 Notes before you power on
A few things save you a confused evening. Give the sensor a real 5 volt supply; on 3.3 volt the range shrinks and readings get noisy. Never wire Echo straight to a GPIO without the divider. If every reading comes back as 0 or nonsense, check VCC and GND are not swapped and that the divider node actually reaches GPIO 18. Aim the sensor at a flat surface; a soft or angled target scatters the echo and the number jumps around.
5. Test Code
Before the web dashboard, get a plain reading over the Serial Monitor. It proves the wiring and the divider are right. The logic is short: trigger a ping, time the Echo pulse, convert to centimeters, reject anything outside 2 to 400 cm.
The whole thing is one file. Open it in the Arduino IDE and upload, no extra tabs. Every setting you might change, the pins, the read interval, a calibration offset, sits in a labelled block at the top:
/*
 * HC-SR04 Ultrasonic Distance — Test Sketch
 * OmArTronics · Project 01 · 2026-07-25 · MIT License
 *
 * Prints distance in cm over Serial at 115200 baud.
 * Wiring: Trig -> GPIO 5, Echo -> GPIO 18 through a 1k/2.2k divider (5V -> 3.44V),
 *         VCC -> 5V, GND -> GND.  See wiring.md.
 *
 * Single file — just open in the Arduino IDE and upload. Change pins below.
 */

// ===== Settings (edit these) =====
#define TRIG_PIN            5       // ESP32 GPIO 5  -> HC-SR04 Trig
#define ECHO_PIN            18      // ESP32 GPIO 18 <- Echo via 1k/2.2k divider
#define READING_INTERVAL_MS 60      // datasheet suggests >= 60 ms between pings
#define ECHO_TIMEOUT_US     25000   // ~430 cm round trip; pulseIn gives up after this
#define SERIAL_BAUD         115200
#define SOUND_CM_PER_US     0.0343f // speed of sound at 20 C, cm per microsecond
#define DIST_MIN_CM         2.0f    // datasheet minimum
#define DIST_MAX_CM         400.0f  // datasheet maximum
#define CALIBRATION_OFFSET  0.0f    // cm added after conversion (tune vs a ruler)
#define CALIBRATION_SCALE   1.0f    // multiply reading (1.0 = no change)
// =================================

// One measurement. Returns distance in cm, or NAN if the reading is invalid.
float readDistanceCm() {
  // 10 us trigger pulse tells the module to fire an 8-cycle 40 kHz burst.
  digitalWrite(TRIG_PIN, LOW);
  delayMicroseconds(2);
  digitalWrite(TRIG_PIN, HIGH);
  delayMicroseconds(10);
  digitalWrite(TRIG_PIN, LOW);

  // pulseIn measures how long Echo stays HIGH, in microseconds.
  // It returns 0 if no echo arrives before the timeout.
  unsigned long echo_us = pulseIn(ECHO_PIN, HIGH, ECHO_TIMEOUT_US);
  if (echo_us == 0) return NAN;                 // timeout: nothing in range

  // Convert time of flight to distance (divide by 2 for the round trip).
  float cm = (echo_us * SOUND_CM_PER_US) / 2.0f;
  cm = cm * CALIBRATION_SCALE + CALIBRATION_OFFSET;

  // Reject readings outside the datasheet range.
  if (cm < DIST_MIN_CM || cm > DIST_MAX_CM) return NAN;
  return cm;
}

void setup() {
  Serial.begin(SERIAL_BAUD);
  pinMode(TRIG_PIN, OUTPUT);
  pinMode(ECHO_PIN, INPUT);
  digitalWrite(TRIG_PIN, LOW);
  delay(50);
  Serial.println(F("HC-SR04 test ready. Distance in cm:"));
}

void loop() {
  float cm = readDistanceCm();
  if (isnan(cm)) {
    Serial.println(F("-- out of range / no echo --"));
  } else {
    Serial.print(cm, 1);
    Serial.println(F(" cm"));
  }
  delay(READING_INTERVAL_MS);
}
A few lines deserve a note. pulseIn(ECHO_PIN, HIGH, ECHO_TIMEOUT_US) blocks until Echo goes high and then low, and returns the high time in microseconds, or 0 if nothing comes back before the timeout. The / 2.0f is the round-trip correction from section 2. isnan(cm) catches both the timeout and out-of-range cases with one check, so the loop prints a clean “out of range” line instead of a wild number.
Expected Serial Monitor output at 115200 baud, moving a hand toward the sensor:
HC-SR04 test ready. Distance in cm:
34.2 cm
28.9 cm
19.9 cm
11.3 cm
-- out of range / no echo --
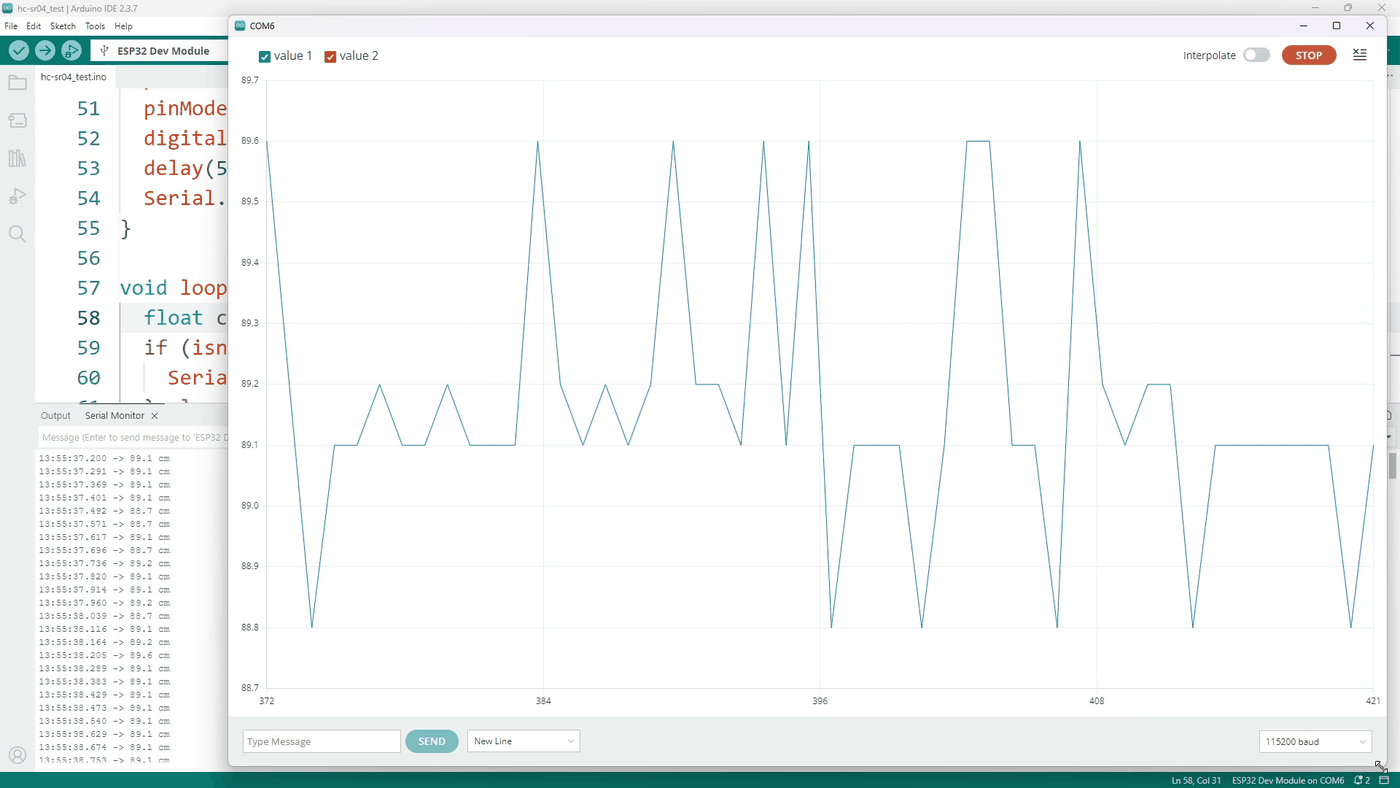
That screenshot is worth a second look. The board is aimed at a wall that is not moving, and the Serial Plotter still draws a jagged line. Everything you see between 88.7 and 89.6 cm is the sensor talking to itself, not the wall going anywhere. Section 7 puts numbers on it.
The values above are what a hand moving in and out in front of the sensor looks like on the Serial Monitor. Once the dashboard in section 6 is running you will not go back to reading numbers scroll past, but this step is still worth doing first: if the Serial output is wrong, the wiring is wrong, and no amount of web server will fix that.
6. Live Web-Plotter
6.1 How it works
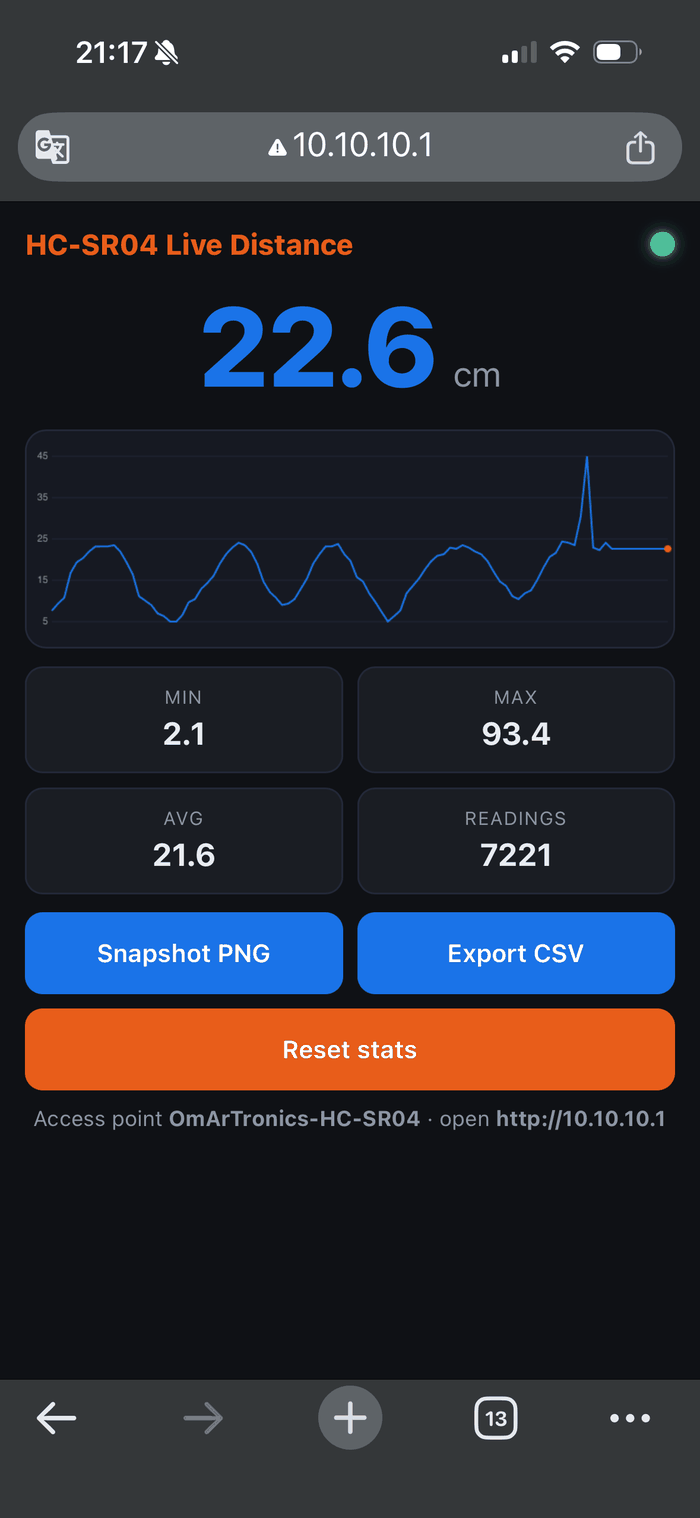
The plotter sketch turns the ESP32 into its own WiFi access point and a small web server. Your phone joins the network “OmArTronics-HC-SR04”, opens http://10.10.10.1, and the page polls a JSON endpoint five times a second. No internet, no app store, no cloud. The dashboard itself is stored inside the firmware, so the chip serves its own front end with nothing else installed.
6.2 Dashboard features
The page shows one large live number, a rolling chart of the last 100 readings that scales its own axis, and cards for the running minimum, maximum, average, and total count. A snapshot button saves the chart as a PNG, an export button downloads the buffered readings as CSV, and a reset button clears the statistics on the ESP32. A dot in the corner turns red and the value blanks if three polls in a row fail, then reconnects on its own.
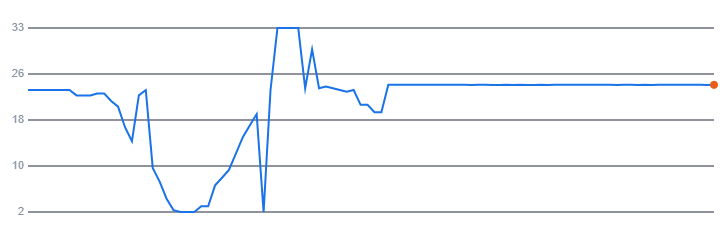
The two export buttons are the reason this exists. Section 7 of this post is written from a CSV that came out of that button, not from the datasheet. The snapshot button produces exactly this, straight from the browser canvas:
6.3 Firmware
The plotter reuses the same measurement code as the test sketch, wraps it in running statistics, and adds three JSON endpoints. The loop never calls delay(); it services web clients on every pass and takes a reading only when READING_INTERVAL_MS has elapsed.
The part worth studying is how the web page gets onto the chip. The whole dashboard, HTML plus CSS plus JavaScript, sits in the sketch as PROGMEM string literals and is served with server.send_P(). PROGMEM keeps the text in program flash instead of copying it into RAM at boot, and send_P streams it out of flash straight to the socket. The page never occupies a single byte of the ESP32’s limited RAM, and it travels with the firmware in one upload. Section 6.5 explains why that matters more than it sounds.
/*
* HC-SR04 Live Web-Plotter — ESP32 Access Point, single-sketch build
* OmArTronics · Project 01 · MIT License
*
* ONE upload. That is the whole point of this version.
*
* The dashboard (HTML, CSS, JavaScript) is embedded in the sketch as PROGMEM
* strings, so it travels with the firmware into flash. No LittleFS, no data/
* folder, no IDE plugin, no second upload step. The earlier build kept the
* dashboard on a LittleFS partition and every single failure I hit was in that
* handover: wrong partition scheme, Serial Monitor holding the port, the IDE 2.x
* uploader plugin refusing to appear. The dashboard is 6.9 KB. Flash is 4 MB.
* Carrying it in the sketch costs nothing and removes an entire class of bugs.
*
* Steps:
* 1) Upload this sketch
* 2) Join WiFi "OmArTronics-HC-SR04", password "ultrasonic"
* 3) Open http://10.10.10.1
*
* Wiring: TRIG -> GPIO 5, ECHO -> GPIO 18 through a 1k / 2.2k divider (3.44 V
* at the node), VCC -> 5V, GND -> GND. See the blog post for the schematic.
*
* Boot log runs at 115200 baud.
*/
#include <WiFi.h>
#include <WebServer.h>
#include <ArduinoJson.h>
// ===== Settings (edit these) =====
#define TRIG_PIN 5
#define ECHO_PIN 18
#define READING_INTERVAL_MS 60
#define ECHO_TIMEOUT_US 25000
#define SERIAL_BAUD 115200
#define SOUND_CM_PER_US 0.0343f
#define DIST_MIN_CM 2.0f
#define DIST_MAX_CM 400.0f
#define CALIBRATION_OFFSET 0.0f
#define CALIBRATION_SCALE 1.0f
#define WIFI_SSID "OmArTronics-HC-SR04"
#define WIFI_PASS "ultrasonic"
// =================================
WebServer server(80);
// --- Running statistics ---
float g_last = NAN, g_min = NAN, g_max = NAN;
double g_sum = 0.0;
unsigned long g_count = 0;
unsigned long g_lastReadMs = 0;
// ============================================================================
// The dashboard. Everything between R"rawname( and )rawname" is copied verbatim
// into flash, so you can edit it like a normal web file. The only rule: the
// content must never contain the closing sequence )rawname".
// ============================================================================
static const char INDEX_HTML[] PROGMEM = R"HTMLPAGE(<!DOCTYPE html>
<html lang="en">
<head>
<meta charset="utf-8">
<meta name="viewport" content="width=device-width, initial-scale=1">
<meta name="theme-color" content="#0f1115">
<link rel="manifest" href="manifest.json">
<title>HC-SR04 Live Plotter</title>
<link rel="stylesheet" href="style.css">
</head>
<body>
<header>
<h1>HC-SR04 Live Distance</h1>
<span id="dot" class="dot" title="connection"></span>
</header>
<main>
<section class="live">
<div id="value">--</div><div class="unit">cm</div>
</section>
<canvas id="chart" width="720" height="240" aria-label="Rolling distance chart"></canvas>
<section class="cards">
<div class="card"><div class="lbl">MIN</div><div id="min" class="num">--</div></div>
<div class="card"><div class="lbl">MAX</div><div id="max" class="num">--</div></div>
<div class="card"><div class="lbl">AVG</div><div id="avg" class="num">--</div></div>
<div class="card"><div class="lbl">READINGS</div><div id="count" class="num">0</div></div>
</section>
<section class="btns">
<button id="snap">Snapshot PNG</button>
<button id="csv">Export CSV</button>
<button id="reset" class="warn">Reset stats</button>
</section>
<p class="hint">Access point <b>OmArTronics-HC-SR04</b> · open <b>http://10.10.10.1</b></p>
</main>
<script src="script.js"></script>
</body>
</html>
)HTMLPAGE";
static const char STYLE_CSS[] PROGMEM = R"CSSPAGE(
*{box-sizing:border-box;margin:0;padding:0}
body{background:#0f1115;color:#e8ecf2;font-family:-apple-system,Segoe UI,Roboto,Arial,sans-serif;max-width:820px;margin:0 auto;padding:14px}
header{display:flex;align-items:center;justify-content:space-between;margin-bottom:10px}
h1{font-size:clamp(16px,4vw,22px);color:#E85D1A;font-weight:800}
.dot{width:14px;height:14px;border-radius:50%;background:#c23b22;box-shadow:0 0 8px #c23b22;transition:.3s}
.dot.ok{background:#39c07a;box-shadow:0 0 8px #39c07a}
.live{display:flex;align-items:baseline;gap:8px;justify-content:center;margin:8px 0}
#value{font-size:clamp(44px,16vw,84px);font-weight:800;color:#1a73e8;transition:color .2s}
.unit{font-size:clamp(16px,5vw,26px);color:#8b95a6}
canvas{width:100%;height:auto;background:#161922;border:1px solid #232838;border-radius:12px;display:block;margin:8px 0}
.cards{display:grid;grid-template-columns:repeat(4,1fr);gap:8px;margin:10px 0}
.card{background:#1a1d23;border:1px solid #232838;border-radius:10px;padding:10px 8px;text-align:center}
.lbl{font-size:10.5px;color:#8b95a6;letter-spacing:.5px}
.num{font-size:clamp(15px,4.5vw,20px);font-weight:700;margin-top:3px}
.btns{display:flex;gap:8px;flex-wrap:wrap;margin:6px 0}
button{flex:1 1 130px;min-height:46px;border:none;border-radius:10px;background:#1a73e8;color:#fff;font-size:14px;font-weight:600;cursor:pointer}
button.warn{background:#E85D1A}
button:active{transform:translateY(1px)}
.hint{font-size:12px;color:#8b95a6;text-align:center;margin-top:8px}
@media(max-width:460px){.cards{grid-template-columns:repeat(2,1fr)}}
)CSSPAGE";
static const char SCRIPT_JS[] PROGMEM = R"JSPAGE(
// HC-SR04 live plotter — polls the ESP32 JSON API, draws a rolling chart.
var MAX_POINTS = 100;
var series = []; // {t, v} rolling buffer for chart + CSV
var fails = 0;
var dot = document.getElementById('dot');
var elV = document.getElementById('value');
var elMin = document.getElementById('min'), elMax = document.getElementById('max');
var elAvg = document.getElementById('avg'), elCount = document.getElementById('count');
var cv = document.getElementById('chart'), cx = cv.getContext('2d');
// The sensor resolves to about 3 mm, so printing more than one decimal would be
// inventing precision the hardware does not have. The CSV keeps the raw value.
function fmt(x){ return (x===null||x===undefined||isNaN(x))?'--':(+x).toFixed(1); }
function setConnected(ok){
dot.classList.toggle('ok', ok);
if(!ok){ elV.textContent='--'; elV.style.color='#c23b22'; }
else { elV.style.color='#1a73e8'; }
}
function poll(){
fetch('/api/data',{cache:'no-store'}).then(function(r){return r.json();}).then(function(d){
fails = 0; setConnected(true);
elV.textContent = fmt(d.value);
elMin.textContent = fmt(d.min); elMax.textContent = fmt(d.max);
elAvg.textContent = fmt(d.avg); elCount.textContent = d.count||0;
if(d.value!==null && d.value!==undefined && !isNaN(d.value)){
series.push({t:d.timestamp_ms, v:+d.value});
if(series.length>MAX_POINTS) series.shift();
draw();
}
}).catch(function(){
fails++; if(fails>=3) setConnected(false);
});
}
function draw(){
var W=cv.width, H=cv.height, pad=28;
cx.clearRect(0,0,W,H);
cx.strokeStyle='#232838'; cx.lineWidth=1;
for(var i=0;i<=4;i++){ var y=pad+(H-2*pad)*i/4; cx.beginPath(); cx.moveTo(pad,y); cx.lineTo(W-6,y); cx.stroke(); }
if(series.length<2) return;
var vals=series.map(function(p){return p.v;});
var lo=Math.min.apply(null,vals), hi=Math.max.apply(null,vals);
if(hi-lo<1){ hi+=1; lo-=1; } // avoid flat-line divide by zero
cx.fillStyle='#8b95a6'; cx.font='11px sans-serif'; cx.textAlign='right';
for(var k=0;k<=4;k++){ var val=hi-(hi-lo)*k/4; var yy=pad+(H-2*pad)*k/4; cx.fillText(val.toFixed(0),pad-4,yy+3); }
cx.strokeStyle='#1a73e8'; cx.lineWidth=2; cx.beginPath();
series.forEach(function(p,idx){
var x=pad+(W-pad-6)*idx/(MAX_POINTS-1);
var y=pad+(H-2*pad)*(1-(p.v-lo)/(hi-lo));
idx?cx.lineTo(x,y):cx.moveTo(x,y);
});
cx.stroke();
var last=series[series.length-1];
var lx=pad+(W-pad-6)*(series.length-1)/(MAX_POINTS-1);
var ly=pad+(H-2*pad)*(1-(last.v-lo)/(hi-lo));
cx.fillStyle='#E85D1A'; cx.beginPath(); cx.arc(lx,ly,4,0,7); cx.fill();
}
function download(name, url){
var a=document.createElement('a'); a.href=url; a.download=name; a.click();
}
document.getElementById('snap').onclick=function(){
download('hc-sr04_'+Date.now()+'.png', cv.toDataURL('image/png'));
};
document.getElementById('csv').onclick=function(){
var rows=['timestamp_ms,distance_cm'];
series.forEach(function(p){ rows.push(p.t+','+p.v.toFixed(1)); });
download('hc-sr04_'+Date.now()+'.csv', 'data:text/csv,'+encodeURIComponent(rows.join('\n')));
};
document.getElementById('reset').onclick=function(){
fetch('/api/reset',{method:'POST'}).then(function(){ series=[]; draw(); });
};
if('serviceWorker' in navigator){ navigator.serviceWorker.register('sw.js').catch(function(){}); }
setConnected(false);
setInterval(poll, 200);
poll();
)JSPAGE";
// Lets the phone install the page as an app icon. Optional, costs 200 bytes.
static const char MANIFEST_JSON[] PROGMEM = R"MANPAGE({
"name":"HC-SR04 Live Plotter","short_name":"HC-SR04","start_url":"/",
"display":"standalone","background_color":"#0f1115","theme_color":"#0f1115"}
)MANPAGE";
// The service worker only registers itself. Caching the shell would fight the
// live data, and the pages already ship inside the firmware.
static const char SW_JS[] PROGMEM = R"SWPAGE(
self.addEventListener('install', function(){ self.skipWaiting(); });
self.addEventListener('activate', function(e){ e.waitUntil(self.clients.claim()); });
)SWPAGE";
// ============================================================================
// Sensor
// ============================================================================
float readSensor() {
digitalWrite(TRIG_PIN, LOW);
delayMicroseconds(2);
digitalWrite(TRIG_PIN, HIGH);
delayMicroseconds(10);
digitalWrite(TRIG_PIN, LOW);
unsigned long echo_us = pulseIn(ECHO_PIN, HIGH, ECHO_TIMEOUT_US);
if (echo_us == 0) return NAN;
float cm = (echo_us * SOUND_CM_PER_US) / 2.0f;
cm = cm * CALIBRATION_SCALE + CALIBRATION_OFFSET;
if (cm < DIST_MIN_CM || cm > DIST_MAX_CM) return NAN;
return cm;
}
void updateStats(float cm) {
g_last = cm;
if (isnan(g_min) || cm < g_min) g_min = cm;
if (isnan(g_max) || cm > g_max) g_max = cm;
g_sum += cm;
g_count++;
}
// ============================================================================
// HTTP handlers
// ============================================================================
void handleData() {
StaticJsonDocument<256> doc;
doc["sensor"] = "HC-SR04";
doc["unit"] = "cm";
// Raw values, not rounded. The dashboard rounds for display; the CSV export
// and anyone reading the API directly gets what the sensor actually produced.
if (isnan(g_last)) doc["value"] = nullptr; else doc["value"] = g_last;
if (isnan(g_min)) doc["min"] = nullptr; else doc["min"] = g_min;
if (isnan(g_max)) doc["max"] = nullptr; else doc["max"] = g_max;
doc["avg"] = g_count ? (g_sum / g_count) : 0.0;
doc["count"] = g_count;
doc["timestamp_ms"] = millis();
String out; serializeJson(doc, out);
server.send(200, "application/json", out);
}
void handleStatus() {
StaticJsonDocument<256> doc;
doc["uptime_s"] = millis() / 1000;
doc["clients"] = WiFi.softAPgetStationNum();
doc["readings"] = g_count;
doc["free_heap"] = ESP.getFreeHeap();
String out; serializeJson(doc, out);
server.send(200, "application/json", out);
}
void handleReset() {
g_min = g_max = g_last = NAN;
g_sum = 0.0; g_count = 0;
server.send(200, "application/json", "{\"ok\":true}");
}
// send_P streams straight out of flash, so the page never occupies RAM.
void handleIndex() { server.send_P(200, "text/html", INDEX_HTML); }
void handleCss() { server.send_P(200, "text/css", STYLE_CSS); }
void handleJs() { server.send_P(200, "application/javascript", SCRIPT_JS); }
void handleManifest() { server.send_P(200, "application/json", MANIFEST_JSON); }
void handleSw() { server.send_P(200, "application/javascript", SW_JS); }
// Phones and laptops probe a handful of URLs to decide whether a network has
// internet. Answering them with the dashboard makes the captive-portal popup
// open it directly, which saves typing the IP on a phone.
void handleNotFound() { handleIndex(); }
// ============================================================================
void setup() {
Serial.begin(SERIAL_BAUD);
delay(300);
pinMode(TRIG_PIN, OUTPUT);
pinMode(ECHO_PIN, INPUT);
digitalWrite(TRIG_PIN, LOW);
Serial.println(F("\n--- OmArTronics HC-SR04 Live Plotter ---"));
Serial.printf("Dashboard in flash: %u bytes (html+css+js)\n",
(unsigned)(sizeof(INDEX_HTML) + sizeof(STYLE_CSS) + sizeof(SCRIPT_JS)));
WiFi.mode(WIFI_AP);
WiFi.softAPConfig(IPAddress(10,10,10,1), IPAddress(10,10,10,1), IPAddress(255,255,255,0));
WiFi.softAP(WIFI_SSID, WIFI_PASS);
Serial.print(F("AP up: ")); Serial.println(WiFi.softAPIP());
Serial.print(F("SSID: ")); Serial.println(F(WIFI_SSID));
server.on("/", HTTP_GET, handleIndex);
server.on("/index.html", HTTP_GET, handleIndex);
server.on("/style.css", HTTP_GET, handleCss);
server.on("/script.js", HTTP_GET, handleJs);
server.on("/manifest.json", HTTP_GET, handleManifest);
server.on("/sw.js", HTTP_GET, handleSw);
server.on("/api/data", HTTP_GET, handleData);
server.on("/api/status", HTTP_GET, handleStatus);
server.on("/api/reset", HTTP_POST, handleReset);
server.onNotFound(handleNotFound);
server.begin();
Serial.println(F("Web server started. Open http://10.10.10.1"));
}
void loop() {
server.handleClient();
unsigned long now = millis();
if (now - g_lastReadMs >= READING_INTERVAL_MS) {
g_lastReadMs = now;
float cm = readSensor();
if (!isnan(cm)) updateStats(cm);
}
}
6.4 The dashboard source
Editing HTML inside a C string is unpleasant, so the three files also live as normal web files in web_src/ next to the sketch. They are mirrors of the PROGMEM blocks: change one, paste it into the other, done. The whole front end is under 7 KB, which is nothing against 4 MB of flash.
The page markup:
<!DOCTYPE html>
<html lang="en">
<head>
<meta charset="utf-8">
<meta name="viewport" content="width=device-width, initial-scale=1">
<meta name="theme-color" content="#0f1115">
<link rel="manifest" href="manifest.json">
<title>HC-SR04 Live Plotter</title>
<link rel="stylesheet" href="style.css">
</head>
<body>
<header>
  <h1>HC-SR04 Live Distance</h1>
  <span id="dot" class="dot" title="connection"></span>
</header>

<main>
  <section class="live">
    <div id="value">--</div><div class="unit">cm</div>
  </section>

  <canvas id="chart" width="720" height="240" aria-label="Rolling distance chart"></canvas>

  <section class="cards">
    <div class="card"><div class="lbl">MIN</div><div id="min" class="num">--</div></div>
    <div class="card"><div class="lbl">MAX</div><div id="max" class="num">--</div></div>
    <div class="card"><div class="lbl">AVG</div><div id="avg" class="num">--</div></div>
    <div class="card"><div class="lbl">READINGS</div><div id="count" class="num">0</div></div>
  </section>

  <section class="btns">
    <button id="snap">Snapshot PNG</button>
    <button id="csv">Export CSV</button>
    <button id="reset" class="warn">Reset stats</button>
  </section>
  <p class="hint">Access point <b>OmArTronics-HC-SR04</b> · open <b>http://10.10.10.1</b></p>
</main>
<script src="script.js"></script>
</body>
</html>
The stylesheet, a dark theme in the OmArTronics colours:
*{box-sizing:border-box;margin:0;padding:0}
body{background:#0f1115;color:#e8ecf2;font-family:-apple-system,Segoe UI,Roboto,Arial,sans-serif;max-width:820px;margin:0 auto;padding:14px}
header{display:flex;align-items:center;justify-content:space-between;margin-bottom:10px}
h1{font-size:clamp(16px,4vw,22px);color:#E85D1A;font-weight:800}
.dot{width:14px;height:14px;border-radius:50%;background:#c23b22;box-shadow:0 0 8px #c23b22;transition:.3s}
.dot.ok{background:#39c07a;box-shadow:0 0 8px #39c07a}
.live{display:flex;align-items:baseline;gap:8px;justify-content:center;margin:8px 0}
#value{font-size:clamp(44px,16vw,84px);font-weight:800;color:#1a73e8;transition:color .2s}
.unit{font-size:clamp(16px,5vw,26px);color:#8b95a6}
canvas{width:100%;height:auto;background:#161922;border:1px solid #232838;border-radius:12px;display:block;margin:8px 0}
.cards{display:grid;grid-template-columns:repeat(4,1fr);gap:8px;margin:10px 0}
.card{background:#1a1d23;border:1px solid #232838;border-radius:10px;padding:10px 8px;text-align:center}
.lbl{font-size:10.5px;color:#8b95a6;letter-spacing:.5px}
.num{font-size:clamp(15px,4.5vw,20px);font-weight:700;margin-top:3px}
.btns{display:flex;gap:8px;flex-wrap:wrap;margin:6px 0}
button{flex:1 1 130px;min-height:46px;border:none;border-radius:10px;background:#1a73e8;color:#fff;font-size:14px;font-weight:600;cursor:pointer}
button.warn{background:#E85D1A}
button:active{transform:translateY(1px)}
.hint{font-size:12px;color:#8b95a6;text-align:center;margin-top:8px}
@media(max-width:460px){.cards{grid-template-columns:repeat(2,1fr)}}
And the logic. It polls, keeps a rolling buffer of 100 points, redraws the canvas, and builds the CSV and PNG exports in the browser:
// HC-SR04 live plotter — polls the ESP32 JSON API, draws a rolling chart.
var MAX_POINTS = 100;
var series = [];              // {t, v} rolling buffer for chart + CSV
var fails = 0;
var dot = document.getElementById('dot');
var elV = document.getElementById('value');
var elMin = document.getElementById('min'), elMax = document.getElementById('max');
var elAvg = document.getElementById('avg'), elCount = document.getElementById('count');
var cv = document.getElementById('chart'), cx = cv.getContext('2d');

function fmt(x){ return (x===null||x===undefined||isNaN(x))?'--':(+x).toFixed(1); }

function setConnected(ok){
  dot.classList.toggle('ok', ok);
  if(!ok){ elV.textContent='--'; elV.style.color='#c23b22'; }
  else { elV.style.color='#1a73e8'; }
}

function poll(){
  fetch('/api/data',{cache:'no-store'}).then(function(r){return r.json();}).then(function(d){
    fails = 0; setConnected(true);
    elV.textContent = fmt(d.value);
    elMin.textContent = fmt(d.min); elMax.textContent = fmt(d.max);
    elAvg.textContent = fmt(d.avg); elCount.textContent = d.count||0;
    if(d.value!==null && d.value!==undefined && !isNaN(d.value)){
      series.push({t:d.timestamp_ms, v:+d.value});
      if(series.length>MAX_POINTS) series.shift();
      draw();
    }
  }).catch(function(){
    fails++; if(fails>=3) setConnected(false);
  });
}

function draw(){
  var W=cv.width, H=cv.height, pad=28;
  cx.clearRect(0,0,W,H);
  // grid
  cx.strokeStyle='#232838'; cx.lineWidth=1;
  for(var i=0;i<=4;i++){ var y=pad+(H-2*pad)*i/4; cx.beginPath(); cx.moveTo(pad,y); cx.lineTo(W-6,y); cx.stroke(); }
  if(series.length<2) return;
  var vals=series.map(function(p){return p.v;});
  var lo=Math.min.apply(null,vals), hi=Math.max.apply(null,vals);
  if(hi-lo<1){ hi+=1; lo-=1; }                 // avoid flat-line divide by zero
  // y labels
  cx.fillStyle='#8b95a6'; cx.font='11px sans-serif'; cx.textAlign='right';
  for(var k=0;k<=4;k++){ var val=hi-(hi-lo)*k/4; var yy=pad+(H-2*pad)*k/4; cx.fillText(val.toFixed(0),pad-4,yy+3); }
  // line
  cx.strokeStyle='#1a73e8'; cx.lineWidth=2; cx.beginPath();
  series.forEach(function(p,idx){
    var x=pad+(W-pad-6)*idx/(MAX_POINTS-1);
    var y=pad+(H-2*pad)*(1-(p.v-lo)/(hi-lo));
    idx?cx.lineTo(x,y):cx.moveTo(x,y);
  });
  cx.stroke();
  // last point marker
  var last=series[series.length-1];
  var lx=pad+(W-pad-6)*(series.length-1)/(MAX_POINTS-1);
  var ly=pad+(H-2*pad)*(1-(last.v-lo)/(hi-lo));
  cx.fillStyle='#E85D1A'; cx.beginPath(); cx.arc(lx,ly,4,0,7); cx.fill();
}

function download(name, url){
  var a=document.createElement('a'); a.href=url; a.download=name; a.click();
}
document.getElementById('snap').onclick=function(){
  download('hc-sr04_'+Date.now()+'.png', cv.toDataURL('image/png'));
};
document.getElementById('csv').onclick=function(){
  var rows=['timestamp_ms,distance_cm'];
  series.forEach(function(p){ rows.push(p.t+','+p.v.toFixed(1)); });
  download('hc-sr04_'+Date.now()+'.csv', 'data:text/csv,'+encodeURIComponent(rows.join('\n')));
};
document.getElementById('reset').onclick=function(){
  fetch('/api/reset',{method:'POST'}).then(function(){ series=[]; draw(); });
};

if('serviceWorker' in navigator){ navigator.serviceWorker.register('sw.js').catch(function(){}); }
setConnected(false);
setInterval(poll, 200);
poll();
One detail in there is deliberate. fmt() rounds every displayed value to one decimal. The API returns what the sensor actually produced, which looks like 21.35175 because it comes out of a float division. Five decimals from a sensor the datasheet rates at 3 mm resolution is invented precision. The dashboard shows 21.4, the CSV keeps the raw number, and nobody is misled.
6.5 One upload, and the two days it cost me to get there
This section used to describe a completely different procedure, and the rewrite is the honest part of this post.
The obvious way to put a web page on an ESP32 is LittleFS: the sketch goes into program flash, the web files go into a separate filesystem partition, and the board serves them from there. That is how my robot arm firmware works and it is what almost every tutorial shows. So that is how I built this one.
Then I flashed it, joined the access point, opened 10.10.10.1, and got a page telling me the filesystem was mounted and contained zero files. The sensor was reading perfectly. 10.10.10.1/api/data returned live distances. Only the front end was missing, because the second upload had never happened.
Getting that second upload to work is where the time went. The IDE 1.8 menu item, Tools > ESP32 Sketch Data Upload, does not exist in IDE 2.x. Its replacement, arduino-littlefs-upload, is a .vsix you drop into .arduinoIDE/plugins/ by hand, and on several 2.3.x builds it then refuses to show up in the command palette. Even when it works, it fails silently if the Serial Monitor is holding the COM port, and changing the partition scheme afterwards erases everything you just flashed. I built a browser upload form into the sketch as a workaround, which worked, but it meant the tutorial’s second step was still “now upload five more files”.
Then the obvious question finally arrived: why is the page in a filesystem at all? It is 6.9 KB. The flash is 4 MB. Put it in the sketch.
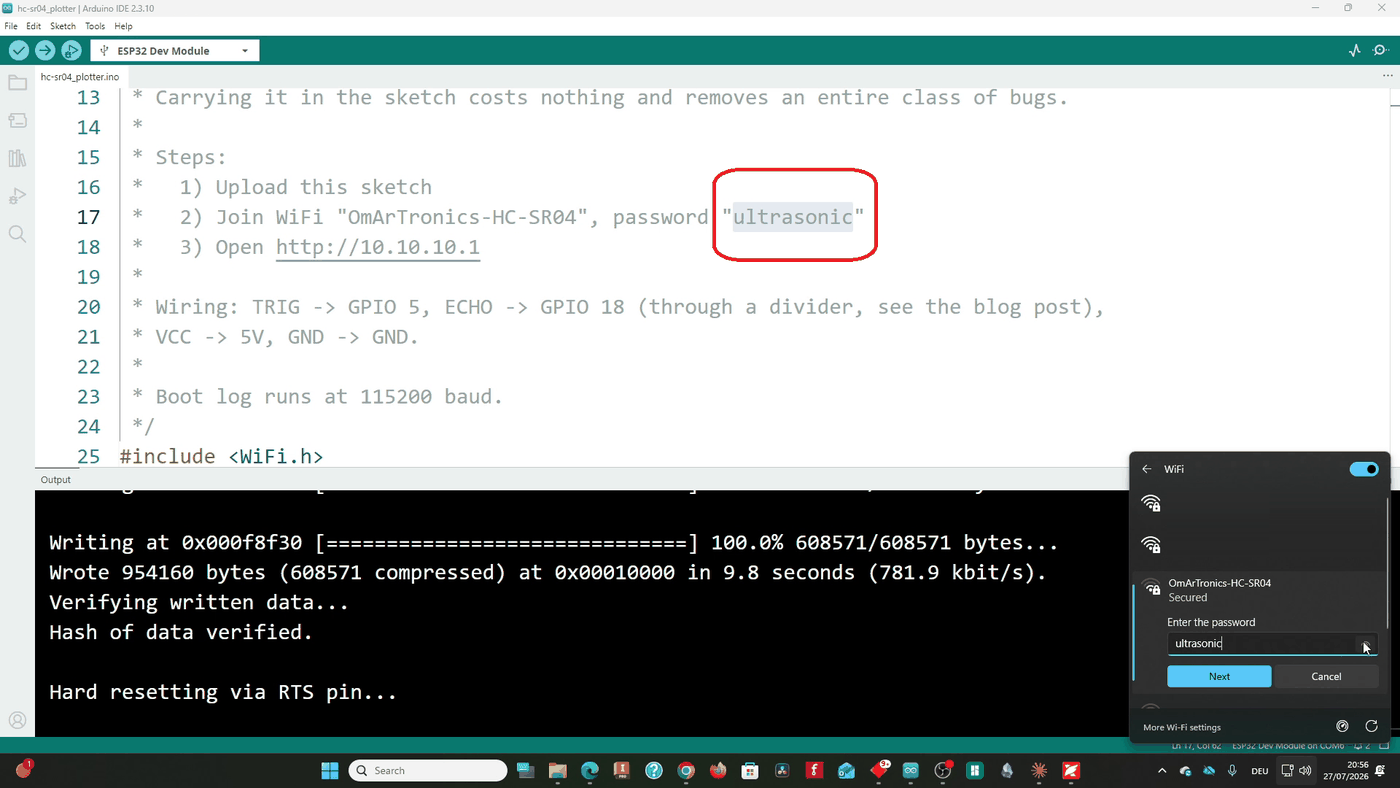
So the dashboard now lives in PROGMEM and the whole procedure is:
- Upload the sketch.
- Join the WiFi network “OmArTronics-HC-SR04”, password
ultrasonic. - مفتوح
http://10.10.10.1.
That is the entire list. No partition scheme to choose, no plugin to install, no Serial Monitor to close, no second upload to forget. The board came up on the first try.
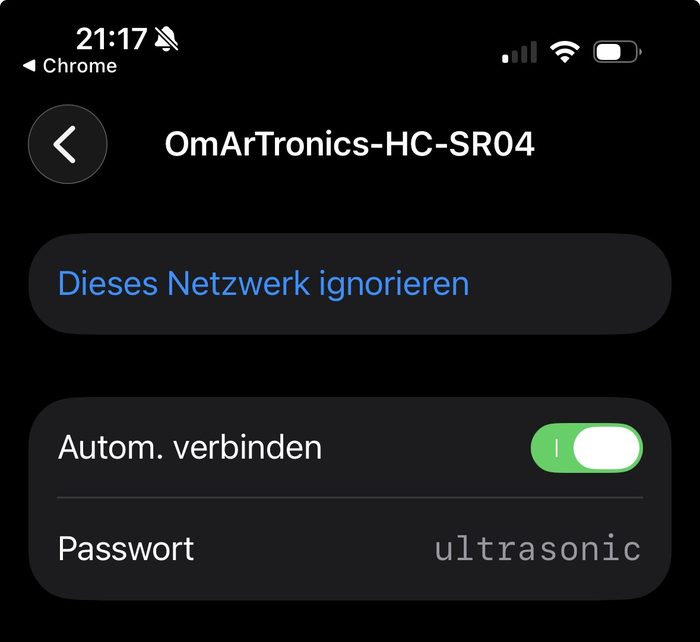
The tradeoff is real and worth stating. A filesystem is the right answer once your front end grows past a few tens of kilobytes, or when you want to update the page without recompiling, or when you need to store logs on the device. For a single-page dashboard that ships with the firmware, it is machinery you carry without using. Every sensor in this series will use the PROGMEM version.
7. Limitations & Edge Cases
This is the part I care most about in this series: what the datasheet claims, and what the sensor on my desk actually did. The numbers below come from the CSV export and the dashboard statistics of a real session, not from the spec sheet.
A motionless target still produces a jagged line. The datasheet lists 0.3 cm resolution and best-case accuracy of ±3 mm. I pointed the sensor at a wall roughly 89 cm away, left everything untouched, and watched the Serial Plotter. Over 24 consecutive readings in 1.55 seconds the values ran from 88.7 to 89.6 cm: a median of 89.1, a standard deviation of 1.8 mm, and a peak-to-peak spread of 9 mm. That spread is three times the resolution the datasheet advertises, and the target never moved a millimetre.
The same thing shows up closer in. A 2.4 second window at about 8 cm gave a mean of 7.67 cm with a 6 mm spread. Nothing is broken in either case, that is simply what a 40 kHz burst and a microsecond timer give you. It does mean that quoting a reading to two decimals is fiction, which is why the dashboard rounds to one.
Single-sample outliers are real and they are large. In a 100-sample export the reading jumped from 22.3 cm to 32.7 cm and back to 23.5 cm within two samples, while the target had not moved that far. On the phone screenshot the same thing shows up as a lone spike to 45 cm in an otherwise smooth curve. One bad echo, one wrong number. If your project acts on distance, take a median of three or five readings instead of trusting a single one. That single spike is the strongest argument in this whole post for plotting your sensor instead of printing it.
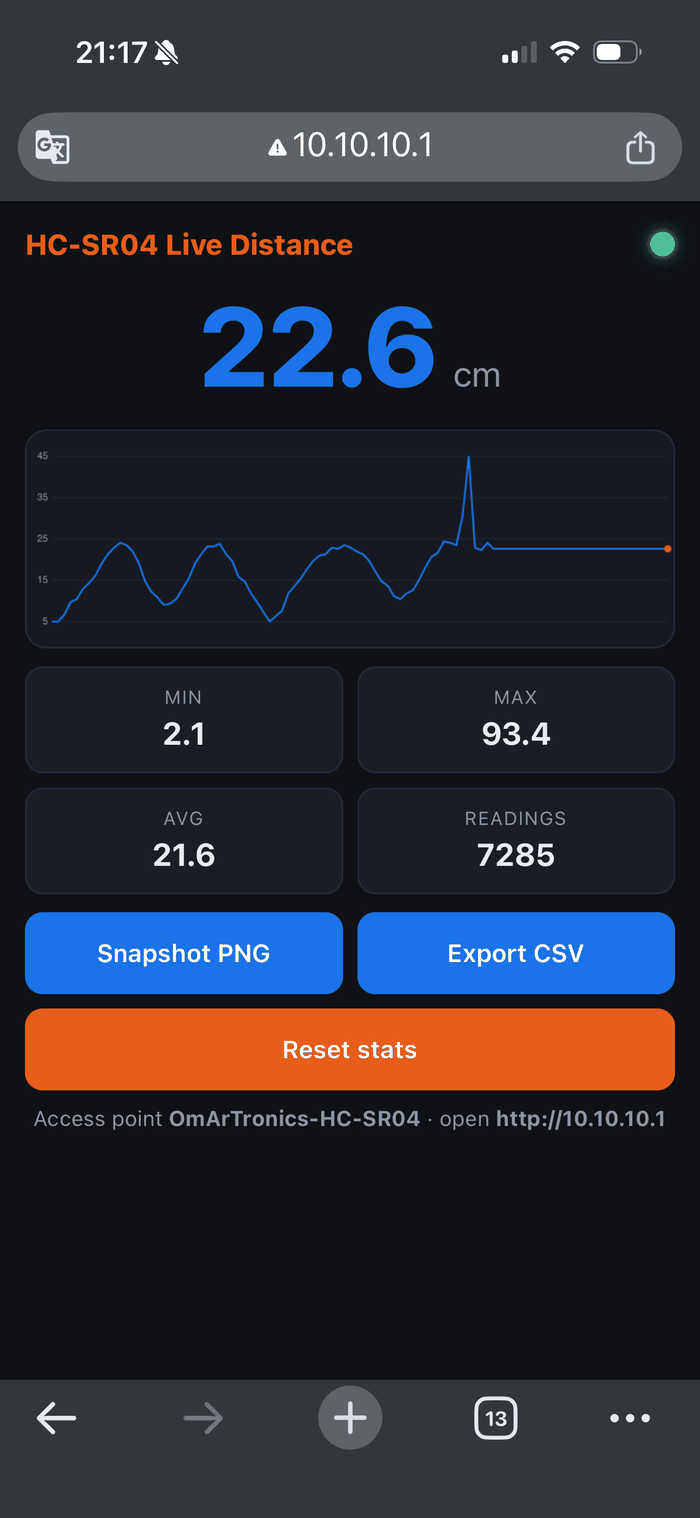
The 2 cm floor is enforced twice. The session’s minimum was 2.1 cm, but that number proves less than it looks. The sketch throws away anything under DIST_MIN_CM, which is set to 2.0. So the floor I measured is partly my own filter, not just the module. The physical reason is real enough: the transducer is still ringing from its own burst when a very close echo comes back, and the module cannot tell the two apart.
Long range is untested here, not disproven. The largest value in the session was 93.4 cm, and an earlier run peaked at 101.4 cm. The datasheet says 400 cm. I never aimed the sensor at anything four metres away, so this is a gap in my testing rather than a finding about the sensor. I would rather say that than pretend a number I did not measure.
Two different sampling rates, and it matters which one you are looking at. The Serial timestamps in the screenshot above sit a median of 78 ms apart against a configured interval of 60 ms; the extra time is the echo flight plus the print. The CSV exported from the dashboard, by contrast, has its samples a median of 205 ms apart, because that file holds what the browser polled, not every reading the ESP32 took. Check which of the two you have before using either as a timing reference.
Still predicted from the datasheet, not yet measured, and honest about it:
- Soft or angled targets: foam, curtains, and anything hit off-square scatter the echo. Expect dropouts rather than wrong-but-plausible numbers.
- Beam width around 15 degrees: the sensor reports the nearest object inside a cone, not a pencil-thin point. A doorframe at the edge of the cone can hijack the reading.
- Temperature drift: the fixed 0.0343 constant assumes 20 degrees C. On a hot day the true distance runs a few tenths of a percent short of the reported value.
- Cross-talk: two HC-SR04 units firing at once can hear each other. Stagger their triggers if you use more than one.
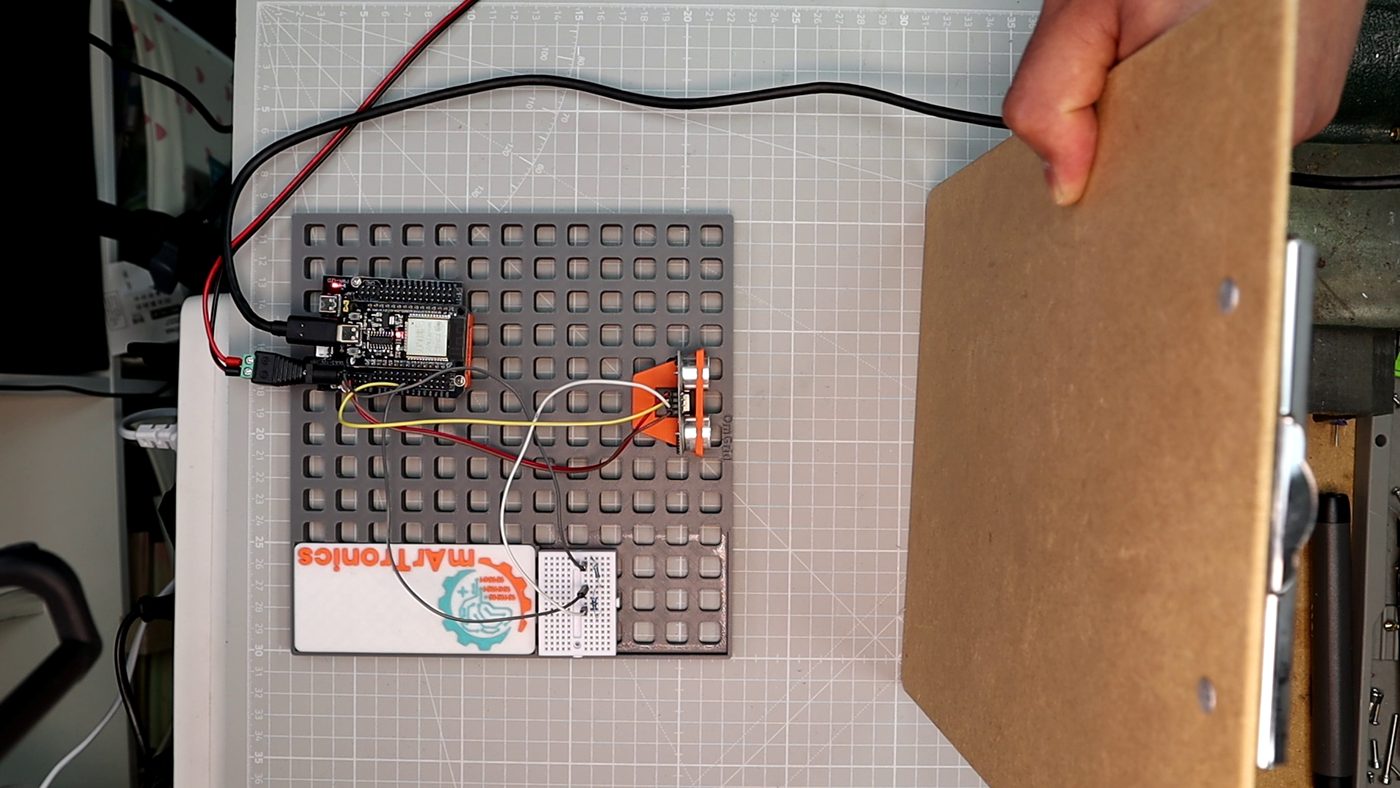
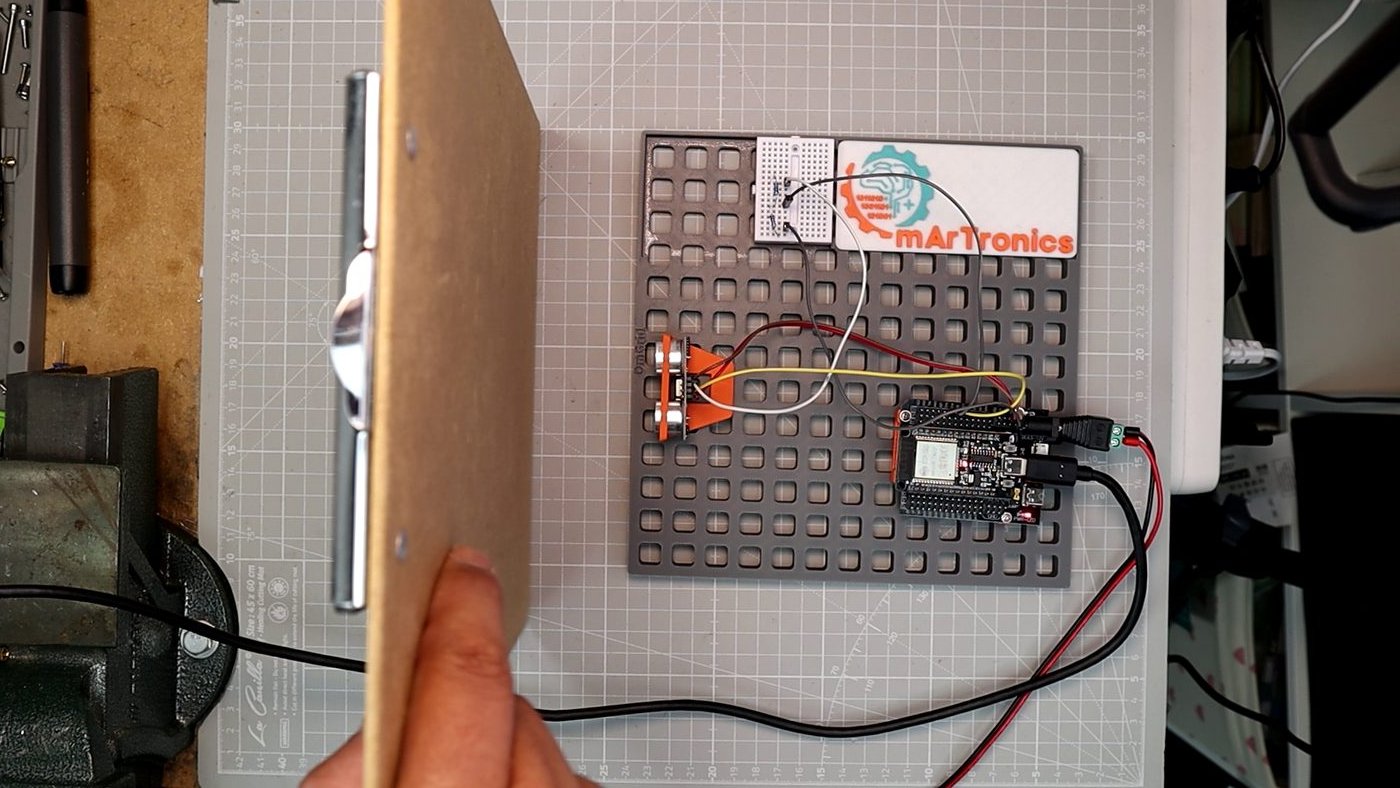
Held square to the sensor, a board like this is the friendly case. Tilted the way it is in the photo, most of the burst bounces away from the sensor instead of back into it, and the reading drops out.
8. Summary & Next Sensor
You wired an HC-SR04 to an ESP32 with a proper Echo divider, read distance over Serial, and then served a live dashboard straight off the chip over WiFi. Along the way you saw why the formula divides by two, why the Echo pin needs 5 to 3.3 volt protection, and where ultrasonic sensing quietly fails.
Five things worth carrying into your next build:
- Divide by two, always. The Echo pulse times the trip out و back.
cm = echo_us * 0.0343 / 2, or the datasheet shortcutecho_us / 58. - The divider is not optional. Echo swings to 5 V, the ESP32 is a 3.3 V part. 1 kOhm / 2.2 kOhm gives 3.44 V on the node, under the 3.6 V absolute maximum, and the parts are in every kit.
- One reading is not a measurement. A motionless wall at 89 cm gave a 9 mm spread, and a single sample jumped 10 cm and came back. Median-filter three to five readings before you act on the number.
- Put the front end in
PROGMEM, not a filesystem. A 6.9 KB dashboard does not need a LittleFS partition, a plugin, and a second upload. One upload, one file, done. - Plot your sensor, do not print it. The false-echo spike in section 7 is invisible in a scrolling Serial Monitor and obvious on a chart.
Quick Reference Card
| Sensor type | Ultrasonic distance, 40 kHz time-of-flight |
| Interface | Digital: 10 us Trigger pulse in, Echo pulse-width out |
| Supply | 5 V, about 15 mA — Echo output needs a divider for 3.3 V MCUs |
| Range (datasheet) | 2 to 400 cm, 0.3 cm resolution, ±3 mm best case |
| Range (measured here) | 2.1 to 101.4 cm tested; 9 mm peak-to-peak spread on a motionless target at 89 cm |
| Update rate | 60 ms minimum cycle (about 16 readings/s) |
| Beam | About 15 degree cone — reports the nearest object in the cone |
| الأفضل لـ | Flat, hard, square-on targets: walls, boards, liquid surfaces, parking assistants |
| Avoid if | Targets are soft, tilted, tiny, closer than 2 cm, or you need millimetre truth |
Next in the series we stay with motion but change the physics: a PIR sensor that reads body heat instead of sound. If you want the same ESP32 doing something bigger in the meantime, the OmArm Zero build puts six servos and a web interface on the same board. See you there.
9. Downloads & Links
| File | What it is |
|---|---|
hc-sr04_test.ino |
Serial test sketch from section 5 |
hc-sr04_plotter.ino |
Live web-plotter, dashboard included, one upload |
web_src/ |
The dashboard as editable HTML, CSS and JS |
schematic.svg |
Wiring diagram with the Echo divider |
OmBlock HC-SR04.stl |
3D-printable sensor holder for the OmGrid |
hc-sr04_animation.html |
The interactive animation from section 3 |
HC-SR04_Guide_EN.pdf |
Printable workbench guide: quick facts, wiring, full code, troubleshooting |
HC-SR04_Guide_AR.pdf |
The same guide in Arabic |
HC-SR04_QuickStart_EN.pdf |
One-page quick start card for the bench |
HC-SR04_QuickStart_AR.pdf |
The quick start card in Arabic |
Firmware is MIT licensed, so use it in anything you like. The CAD and documentation are for personal use.
Datasheet: HC-SR04 (SparkFun mirror)
Parts and kits: OmArTronics shop · the affiliate box in section 4.1 links the individual components.
Next in the series: PIR HC-SR501, where motion gets detected without a single sound wave
Get everything in one free download: فإن HC-SR04 Sensor Lab Package — firmware, wiring files, the full OmGrid STL set, both PDF guides, the 24-slide deck, the animation, and the raw measured data from this post.
شرح بالفيديو: watch the 8-minute build on YouTube.
.